Invoice & Estimate with Alto is a powerful tool that helps entrepreneurs manage the invoicing process. It addresses the challenges that today’s users face by ensuring a secure and efficient exchange of documents with your business partners and clients.
Alto e-invoicing is user-friendly and combines many useful features with advanced functionality. In this series, we walk through the app and explain it.
- App Walkthrough Part 1: Clients
- App Walkthrough Part 2: Settings
- App Walkthrough Part 3: Invoices
- App Walkthrough Part 4: Projects
- App Walkthrough Part 5: Vendors & Expenses
- App Walkthrough Part 6: Estimates
- App Walkthrough Part 7: Reports
App Walkthrough Part Seven: Reports
The Reports feature gives you a quick and easy overview of all the data collected by Invoice & Estimate with Alto.
On the Reports screen, the four icons at the top represent Hours, Expenses, Earnings, and Team Performance.
Let’s take a quick look at each one.
Hours Logged
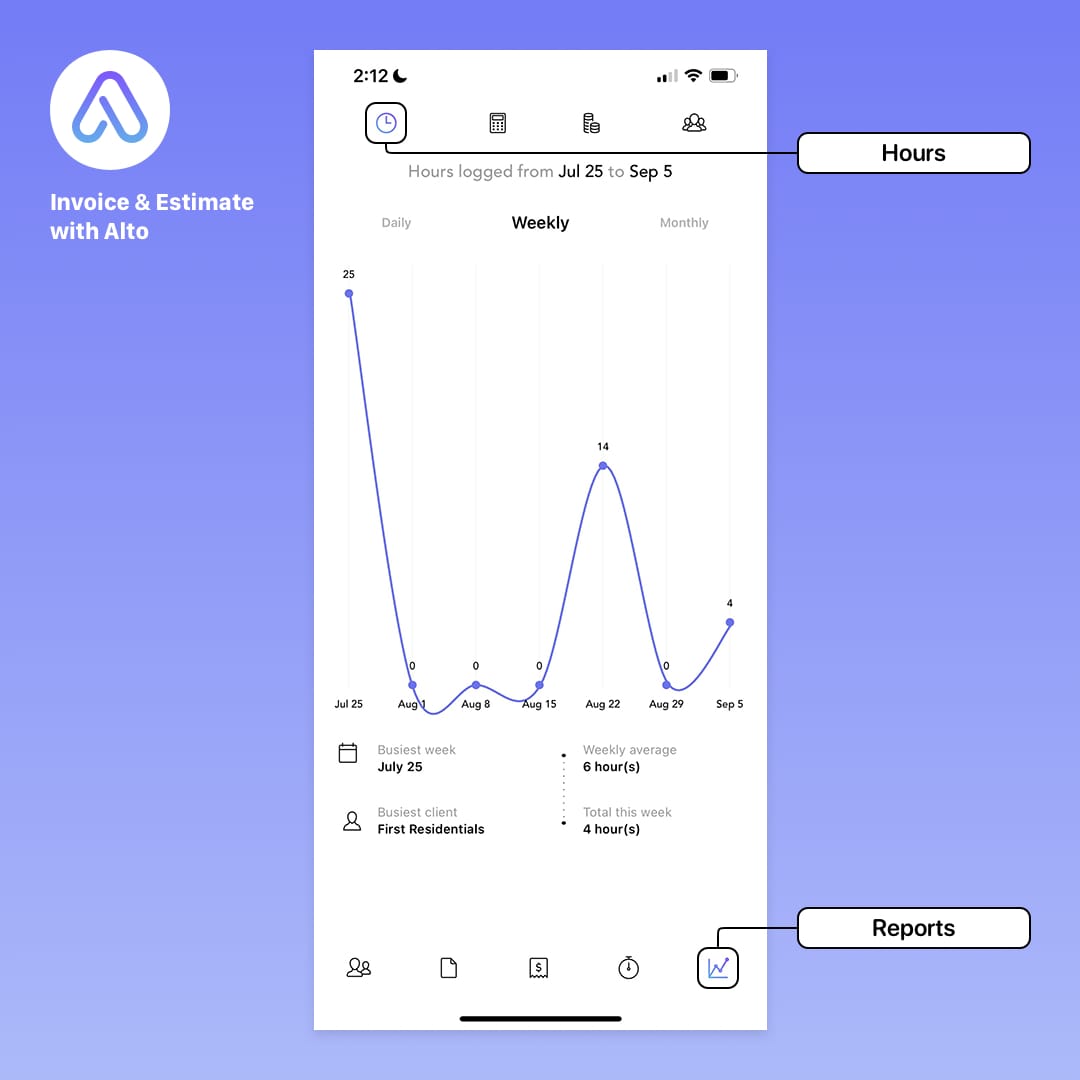
The Hours report collects all the hours you have recorded in Invoice & Estimate, and presents them in a daily, weekly or monthly view.
For example, the Daily view shows a line graph of the hours logged over the last seven days. Below the graph is a table showing the Busiest Day, the Busiest Client, the Average Hours logged per day, and the Total Hours for the week.
The weekly and monthly views do the same, with the Weekly view showing the last seven weeks and the Monthly view showing the last seven months.
All reports will follow this basic configuration.
Expenses Logged
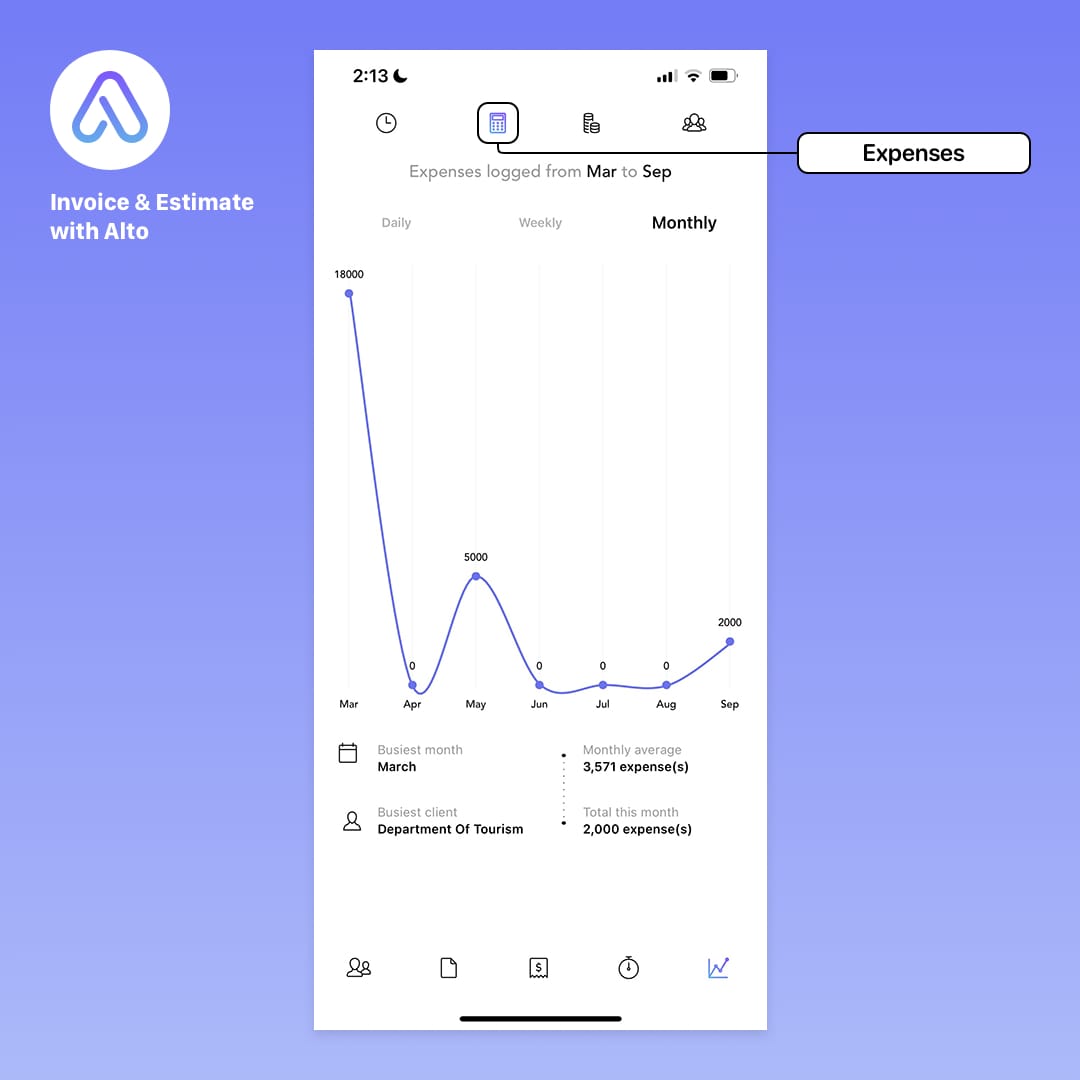
The Expenses report list all the expenses you have created, and shows their totals in a daily, weekly or monthly view.
Unlike the other three reports, this data is displayed as columns, rather than a curved line graph.
This chart can help you identify where you are overspending and whether you need to cut costs to increase profitability.
Earnings Logged
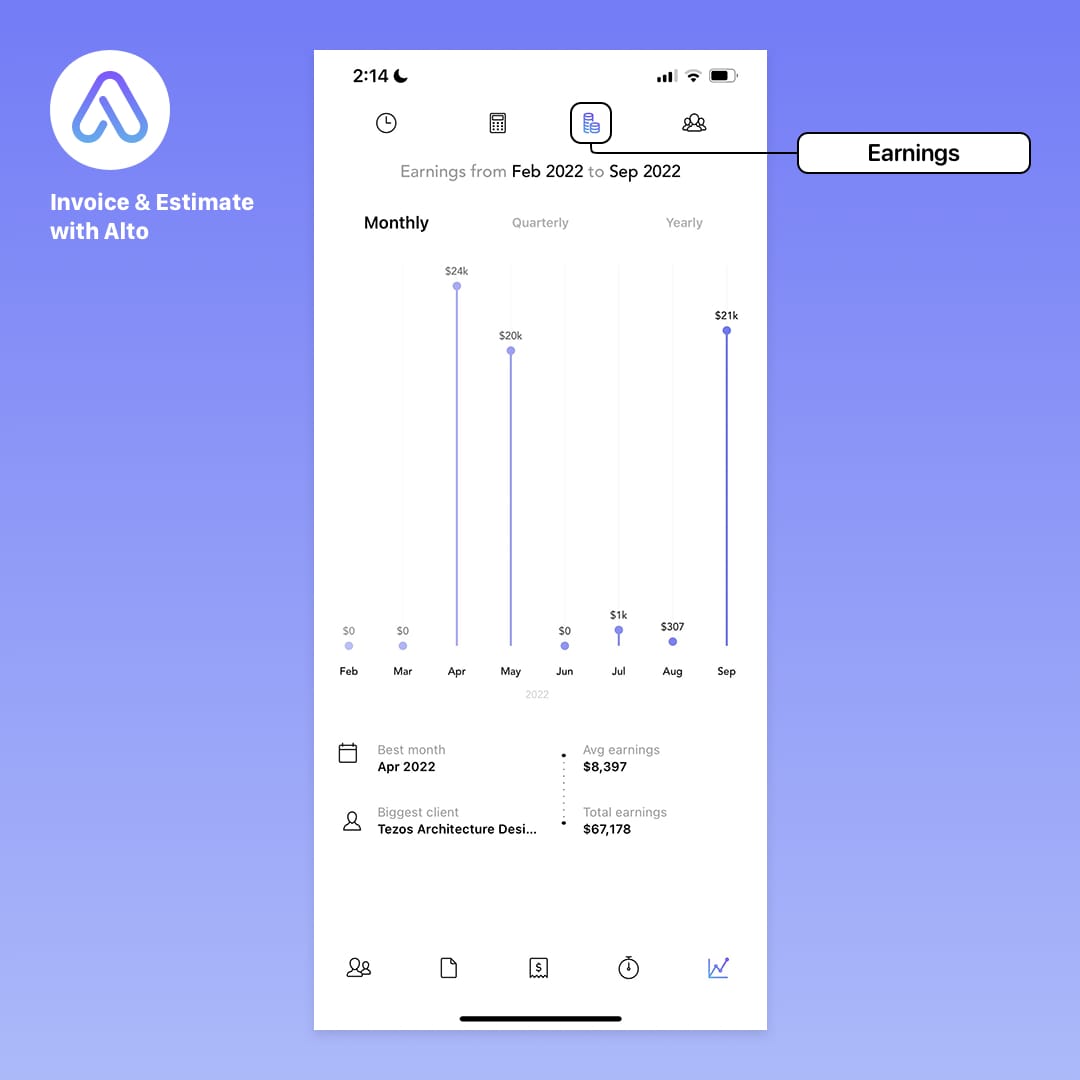
The Earnings report collects the totals for all the invoices you have created, and presents them in a monthly, quarterly or yearly view.
You can use this table to see which month generated the most revenue from which customers, and to get an indication of the most profitable services.
Team Performance
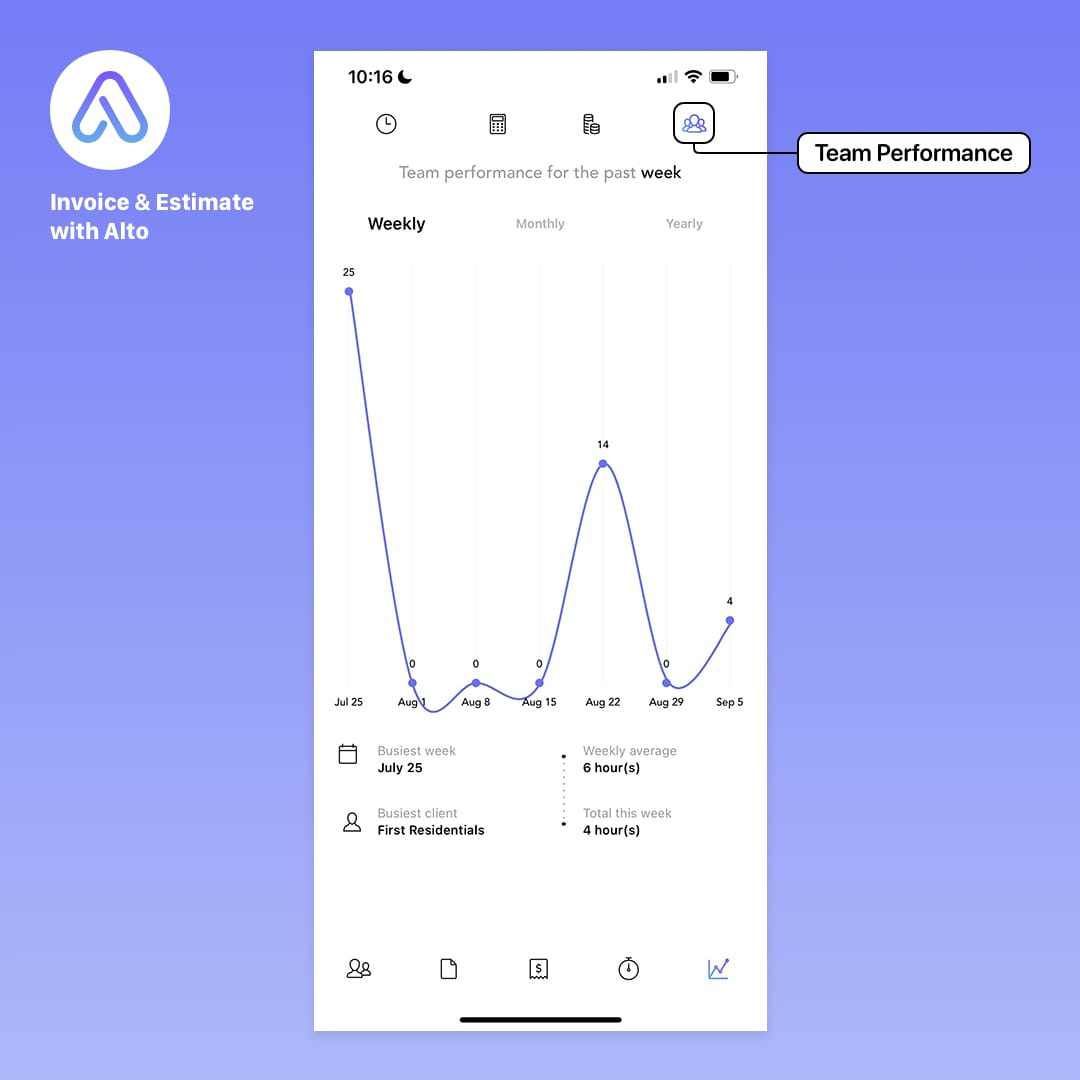
The Team Performance report summarizes all hours logged by all team members and presents them in a weekly, monthly or yearly view.
You can compare this graph to the Hours graph to see the difference between the number of hours you logged and the number of hours logged by the rest of your team.
As you can see, the Reports feature gives you a quick and easy visual overview of your company’s performance. In the current version, the graphs cannot be filtered by client or project, but we plan to introduce this and other improvements in a future update.
Invoice & Estimate with Alto was built for freelancers, consultants, and small businesses by a team of freelancer and small business founders.
Create your free account today and find out why more than 30,000 freelancers and small business owners love Invoice & Estimate with Alto.


